Tuesday, March 06, 2012

Strong Cooling With Wind And Dust


Strong 500 mb short wave digging down the west coast (12Z NAM 500 mb analysis above) will close off and bring a vorticity maximum to just west of Las Vegas by Wednesday morning (NAM 24-hour 500 mb forecast below). Heights fall well over 200 m at 500 mb near the center of the low by 12Z on the 7th of March, indicative of the cold temperatures within the circulation (colder than -30C).


A strong, windy and dusty cold front will cross southern Arizona during the night tonight (see 24-hour NAM 850 mb forecast below), ending the recent warm period (highs in 80s last two days with diurnal temperature range at house of more than 50F).


By Thursday morning another vorticity maximum has intensified on west side of closed low and is positioned just northeast of Tucson (see NAM 48-hour 500 mb forecast below). The western tail of this trough lingers over the Southwest for several days, indicating cool temperatures and more lows below freezing here at house (lows here for first 5 mornings in March ranged from 22F to 32F). Precipitation forecast to remain far to the north and east. 


Monday, March 05, 2012

Cloudy, Dreary Afternoon


View of Catalinas shows current thick cloud cover overhead in Tucson. The WRF-GFS forecast has verified quite well today - see previous post.

Upper-level Short-wave Trough Moving Ashore


The above satellite water-vapor image is for 13 UTC this morning and shows a distinct, upper-level short-wave that is approaching the Southwest. Moisture with this system appears to be mostly middle and upper-level cloudiness. This system provides an opportunity to examine a couple of products available in the output from Atmo's high-resolution version of the WRF-GFS forecast model. The graphic below shows forecast of outgoing long-wave radiation (OLR in W/m2) valid at 2 pm MST this afternoon. Brighter white colors indicate higher and thicker cloud cover.


The last graphic above is the 2 pm forecast for solar irradiance (W/m2) - the color scale goes from dark yellow (sunny) to dark blue (thick cloudiness). Both products indicate considerable higher cloudiness today during parts of the afternoon.

Friday March 2nd Hodographs


I've grabbed the hodograph portion of the SPC sounding/analyses graphic for two special soundings taken on March 2, 2012. The top graphic is for Wilmington (Cinncinati), Ohio at 19 UTC and the bottom is for Nashville, Tennessee at 18 UTC. Both of these illustrate how strong the winds aloft were prior to the tornadic storms that afternoon. Note that winds near and above 300 mb are too strong for the scaling and are off the plots. Both indicate that supercell storms would be possible, and that, if they developed, would be moving to the east-northeast very rapidly, at speeds of 50 to 70 mph.


Sunday, March 04, 2012

Supercells On Friday, March 2nd


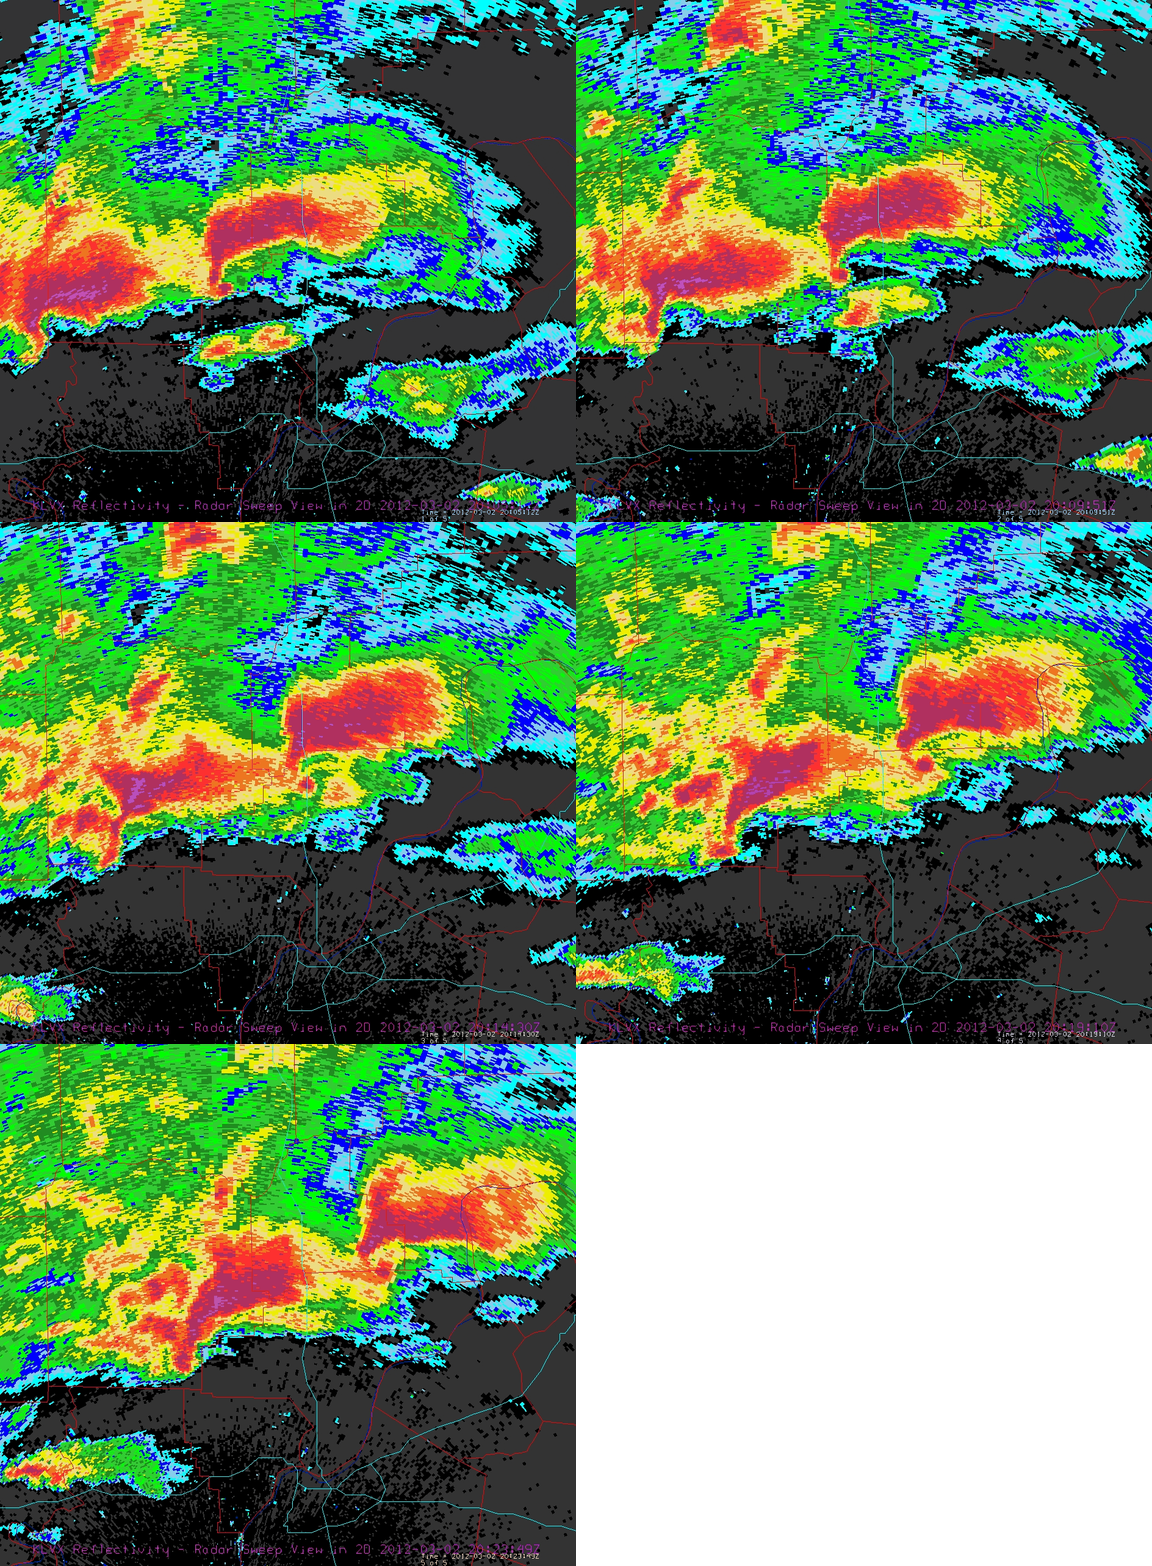
Radar image above shows two supercells, with well-defined hook echoes, north and northwest of Louisville, Kentucky on Friday afternoon. The leading storm produced the tornado that struck Henryville, Indiana.


Radar images above (from Jim LaDue's blog - http://jimladueview.blogspot.com/ ) are of the tornadic supercell that struck West Liberty, Kentucky. Photo below is probably a shot of the West Liberty tornado.


Saturday, March 03, 2012

Another Tragic Tornado Outbreak

As mentioned in yesterday's post, the SPC outlooked a significant outbreak of severe thunderstorms to occur. Figure below shows yesterday's severe thunderstorm and tornado reports for the very significant event that has occurred. There appear to have been a number of long-track supercell thunderstorms, that at times were reported to be moving at speeds near 70 mph. There have been a number of fatalities and reports are still incomplete regarding details of this tragic event.


Below is the 1300 UTC SPC Outlook from yesterday with reports superposed, indicating the accuracy of the SPC outlooks.


The radar graphic above (2300 UTC regional plot of base-scan reflectivity from NCAR) shows numerous supercell thunderstorms, especially in Kentucky. The 2235 UTC reflectivity below (from the NWS KLVX radar at Louisville, Kentucky) is centered on a very intense storm that is to the south of the radar (thanks to Mike Luethold for sending this image). Note that the reflectivity color bar has folded from purple back to black in the storm core - this indicates reflectivity of near or more than 80 dBZ! Extending south of the storm is a distinct three-body-scatter spike (sometimes just called a hail spike), indicating the presence of large hail within the storm-core.


More on this event in later posts.

Friday, March 02, 2012

Early March Storm - With Bit Of Everything

First - David C. asked (a couple of posts ago): Your .37" of precip to 2/29 is drier than even we normally are over here in the (Ay) Chihuahuan Desert region. But once you put in the Nov or to mid-Dec, you aren't too low for precip, are you? 

The best way to look at this is for the first five months of the water year (the water year begins October 1st - since after that date the mountains are likely to begin accumulating winter snowpack). Normal for TUS from October 1st to end of February is 4.19". Here at the house we are 0.31" above that normal. However, we had more rain here than did the airport. The airport (TUS) has had 3.28" during same period and is thus almost an inch below normal


A strong, synoptic cyclone is intensifying over southern Illinois and will move to southern Michigan by 00 UTC this evening (above is NWS forecast surface chart for 6 pm CST from the HPC). The storm will impact Chicago, Milwaukee, and Detroit metropolitan areas significantly. If precipitation turns to snow at Chicago, the evening rush could be impacted. Regardless, the major airports in the lower Great Lakes will probably experience weather-related delays, and problems at O'Hare often ripple across the entire country.

To the south, the SPC expects a significant outbreak of severe thunderstorms (see current outlook below), centered on the Ohio Valley - this would be the second outbreak within a week.


Thursday, March 01, 2012

Off Topic - Today Is/Was National Pig Day

Pigs get kind of a bad rap. You can trot out as much evidence as you like showing how clean and intelligent they are, but, really, you’re fighting an uphill battle against their resilient reputation as slovenly animals,. Nevertheless, pork-loving Texan Mary Lynne Rave and her sister Ellen Stanley declared March 1 to be National Pig Day in 1972 to celebrate our swinish friends and conveniently fill the cold, joyless void between Valentine’s Day and St. Patrick’s Day. Yum!


Wednesday, February 29, 2012

Back From Travel To NYC


We have been away on a trip to NYC since last Friday and returned last evening, Tuesday, February 28th.
We landed at La Guardia in low clouds and rain, but rest of trip was essentially weather-free other than winds and chilly temperatures. Folks in the NYC area are worried about many spring plants that have come out unusually early this year (see posts below that illustrate the unusual warmth in the Northeast). Photos above are of the famous lions - Patience and Fortitude - at the entrance to the New York Public Library.


I don't see even a hint of a sprinkle here at house, and so I assume that there was no precipitation while we were away. The coldest low temperature was 33F, and I suspect that that occurred yesterday morning. There were strong winds and a bit of dust on Monday in Tucson, and a webcam view of Catalinas (above) shows that there were some light showers around. The views from the plane were very very brown from DFW to TUS, across the drought plagued portions of the Southwest. Considerable dust was hanging in the afternoon boundary layer over southeast Arizona and New Mexico, but skies were nearly cloudless.

The current 7-day GFS (operational member - below) forecast of total precipitation for period from now through next Tuesday afternoon (March 6th) continues to keep the Southwest locked in drought. Looks like total rainfall here at the house from mid-December through February will total only 0.37 inches.

Thursday, February 23, 2012

Comment From Tony Haffer

I too was quite surprised that precip this Water Year is below normal in the Pac NW as well as the West in general. Here are a couple of links that show this well. 

http://www.cbrfc.noaa.gov/wsup/westwide/precip/westS201201.png and 

http://www.cbrfc.noaa.gov/wsup/westwide/precip/westS201112.png

Tony Haffer


Wednesday, February 22, 2012

Potatoes And Pringles

Another excursion off-topic.

Mark Bittman had an interesting NY Times blog post yesterday about potatoes and other issues. His post was stimulated by the fact that Procter & Gamble recently sold its Pringles brand name to Kellogg for 2.7 billion dollars. The text below has been extracted from Bittman's post.


“Basically, Kellogg is big in the business of selling hyper-processed grain heavily laced with sugar, so it makes sense that it seize the opportunity to jump into the market of selling hyper-processed potatoes heavily laced with fat and salt.

Don’t, however, make the mistake of blaming the potato for Pringles. (They’re only 42 percent potato anyway, and about 33 percent fat...) Nor should you blame corn for nachos… You can’t blame the raw ingredients with which the earth blesses us for the evil — is that too strong? How about “destructive”? — uses to which they are put.

Yet some people, heavily influenced by the bad press both potatoes and corn routinely garner, have asked me whether those foods are indeed “real” and worth eating at all.

Corn and potatoes are real foods. Unadulterated, an ounce of corn and an ounce of potato contain 24 and 22 calories respectively; their biggest component is water. (A potato is about 80 percent water.) Corn is about 3 percent protein, 2 percent fiber and 1 percent fat; potatoes’ numbers are similar. Not bad.
A 1-ounce serving of corn chips, though, contains around 139 calories,… and an ounce of Pringles runs 150. (Everyone knows, however, that the official 1-ounce serving is nonsense. Even Pringles, which says, “once you pop, you can’t stop.”)” 


Tuesday, February 21, 2012

What's Typical?

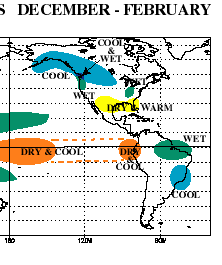
 The above graphic is a simplified plot of what are considered "typical" conditions associated with La Nina during December-February.
Above (from Lance Bosart via the MAP chat board) shows November 2011 - January 2012 temperatures for the continental US. Below is same map but for precipitation. It appears that there is not much similarity with the "typical" La Nina situation (although there is a month offset between these two figures and one at top). When data for the December - February quarter are in there will probably not be dramatic changes. Perhaps most amazing are the remarkable warmth so far this winter across the northeastern third of the country and the extreme dryness over the northwest third of the country.

Sunday, February 19, 2012

Southwest U.S. Continues Very Dry


La Nina continues over the Pacific along the equator - current SST cool departures from normal shown at top. Dry flow patterns continue over the Southwest. The operational GFS forecast of total precipitation for next 7 days is shown jus above. The model predicts no precipitation from west Texas westward across southern California.

We have had only 0.37" of rain since December 18th. The system last Thursday produced some thunderstorms southwest of Tucson, but here at the house we had only a very light sprinkle.

Wednesday, February 15, 2012

Photos From Yesterday


Webcam shots at Kitt Peak (top) and Mt. Lemmon (bottom) at 11 am MST yesterday (February 14th). Kitt Peak had picked up some snow already and light snow was just beginning near Summerhaven in the Catalinas.


Stratus fractus along the Catalina Foothills (above) at 2 pm MST after the main band of showers had passed. The Catalinas turned purple briefly at sunset (below). We some sprinkles during the late afternoon, but no further accumulation - so we ended up with a tenth of an inch of rain here at the house. Chilly morning low of 28F today. Yetserday during the rain around 1 pm the temperature dropped to 34F here at the house.

Tuesday, February 14, 2012

Primary Band Of Showers Has Zipped By


Shown above are the regional radar plots (from NCAR) for 8 am, 10 am, noon, and 2 pm MST. The radar charts show the quick movement of the primary band of showers across Pima County. At 2 pm the sun was back out here at the house, but not before the temperature had dropped into the upper 30s. Most stations in the ALERT network received light rainfall (or snowfall) of 1 to 2 tenths of an inch. Gauge here has exactly a tenth of an inch in it. With the sun back out, the question is now whether we'll get some instability showers as the very cold middle-level air comes over (San Diego was -29C at 500 mb this morning).

Update - This Morning's WRF-GFS - Valentine's Day


First - a shot of stacked lenticular clouds (above) that developed over the Catalinas around 5 pm MST yesterday afternoon.


Atmo's early run of the WRF-GFS is slower today on bringing the current weather system through eastern Pima County. The above forecast is of total precipitation through 6 pm this MST this evening. It is similar to yesterday's, although amounts across the north metro area are up a bit - still generally a light precipitation event, except in the mountains.


The composite radar forecast (above) indicates the primary shower band moving through the metro area around 3 pm (behind the front), and the forecast surface plot valid at 1 pm MST (below) indicates a more amorphous frontal passage during the lunch hour. Will now observe the details of what transpires today.

Monday, February 13, 2012

Fast Hitting Weather System on Valentine's Day


A fast-moving weather system is digging southeastward across northern California this morning. The water vapor image (above, for 14 UTC) shows the upper-tropospheric short-wave to be a bit north of San Francisco. The early (midnight) run of Atmo's WRF-GFS model forecasts this to be a fast hitting system here in southeast Arizona. The plot below shows the forecast by the WRF-GFS of total precipitation through midnight tomorrow (14 February 2012) night. The event is forecast to be mostly one with light precipitation and showers. The most precipitation is indicated, as snow, on the Catalinas and Mt. Graham.


The WRF-GFS forecasts the event to impact the Tucson metro area tomorrow morning. The composite radar echo forecast above is valid at 9 am MST and indicates the main rainband with the system to be moving across eastern Pima County. The forecast 9 am surface plot (below) shows the pronounced cold front moving eastward and about to exit Pima County - with the rain band located along and behind the front.
The WRF-GFS forecasts are similar to those this morning by the NWS NAM model wrt the light character of the event, but are several hours faster than the NAM. So, it appears that a damp and chilly weather event is on tap for Valentine's Day.

Sunday, February 12, 2012

Another Wind Event East Side Of Huachuca Mountains


Art Douglas reports, from near the mouth of Ramsey Canyon,: It's 3:45AM and the wind is howling like crazy at my house.........here is the wind profiler.

He sent along a data display from the Ft. Huachuca wind profiler, and I've snipped out a portion of the time series that runs from around 00 UTC yesterday to around 10 UTC this morning (3 am MST). Note that by around 04 UTC (9 pm MST) a layer of strong winds extends from near mountain-top level upward for about a 100 mb. During the night this layer descends steadily and reaches the surface after midnight. This is the second wind event this year that appears to have been influenced by a mountain-wave downwind of the crest of the Huachuca Mountains.

Edited to add: observations from a weather station near Art indicate a number of gusts before noon today of 40 to 65 mph.

Thursday, February 09, 2012

Thinking Of Hurricane Camille

I've been looking at the photo in the previous post and remembering Category 5 Hurricane Camille. This storm came ashore during the night of August 17, 1969, near Biloxi, Mississippi. Wind speeds approached 200 mph and damage was extreme. Camille's track is shown below.


Above are before and after photos of an apartment complex where more than 30 people, who refused to evacuate and held a hurricane party, perished.

You'd think we'd learn from the past, but the high-rise condos below look like a line of dominos waiting for the next category 5 hurricane.