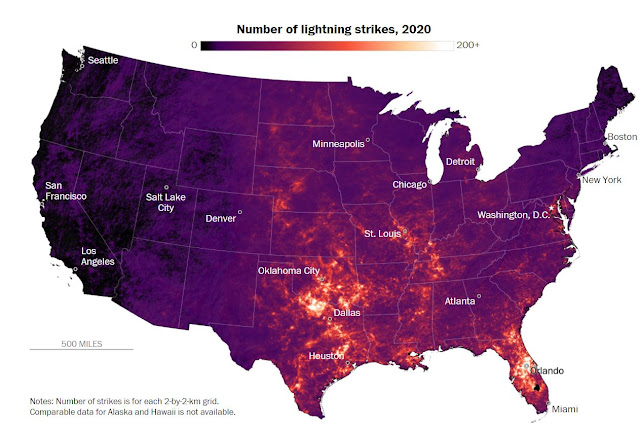
An article in the February 3rd Washington Post reports on a decrease in lightning activity during 2020; the article is at:
https://www.washingtonpost.com/weather/2021/02/03/annual-lightning-activity-us/?arc404=true
Map above shows regions of increase and decrease during 2020 relative to past 5 years. The color bar for above map is unfortunate, since it makes determining the zero change line impossible. However, the "by county" plot below allows one to see the chaotic no change lines (boundary between the light pink and light blue grid boxes). The big changes in California and the Northwest (regions with extremely low lightning activity) were due to a couple of active days in August that triggered numerous significant wildfires. The huge area of the West having fewer lightning flashes reflects the continuing severe drought conditions in that part of the country.
There were significant increases in thunderstorm activity in large area extending from Ohio, across Michigan, much of Minnesota, and the eastern half of North Dakota. there also appears to have been a significant increase in south Texas along the Rio Grande. (Note that chart below is for 1 by 1 km grids rather than 2 by 2.) Some of the other small increase areas in the Plains were likely due to singular intense thunderstorms. Will take a look tomorrow at changes in severe thunderstorms reports.


No comments:
Post a Comment