Map above shows 2020 CG flash density, while map below shows total flash density per county versus five-year average. As per the previous post, the decrease over most of the country is easily seen, as are the increases from Michigan to the northern Plains.
Note that the number of severe and damaging wind reports were essentially the same for both years (16064 in 20219 versus 16039 in 2020).
Changes in reports of severe hail (above 2020 versus 2019 below) are not easily apparent between the two years (2020 above and 2019 below) are not easily apparent, except perhaps in the West. Severe hail is defined by SPC as being 1 inch or greater in diameter. But, the total severe hail reports in 2019 were 5396 versus 4611 in 2020 - a decrease of 15 percent).
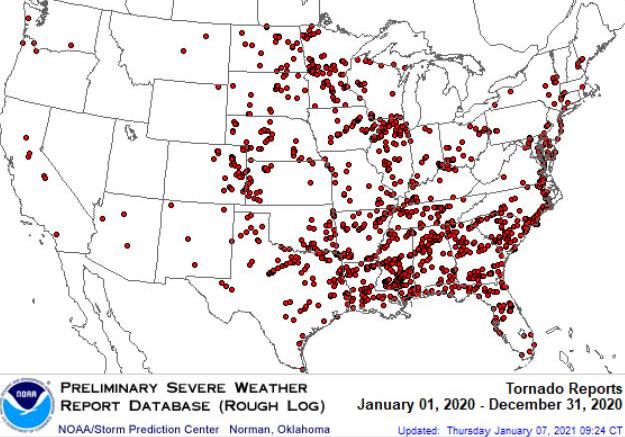
The decrease in tornado reports though for 2020 is fairly apparent in the 2020 plots (above) versus those for 2019 (below). Tornadoes in 2019 numbered 1676 versus 1243 for 2020 - a decrease of 26 percent! This probably means that there were significantly fewer supercells in 2020, as well as fewer occurrences of very large hail


No comments:
Post a Comment